Science Communication Projects
Documentary Films
While at Duke, I made two documentary films: Audubon's Christmas Bird Count and Stilts.
Technologies Used: FinalCut Pro, Adobe Premiere Pro, Photoshop and Illustrator
Data Sources: Varies depending on the film - see film credits
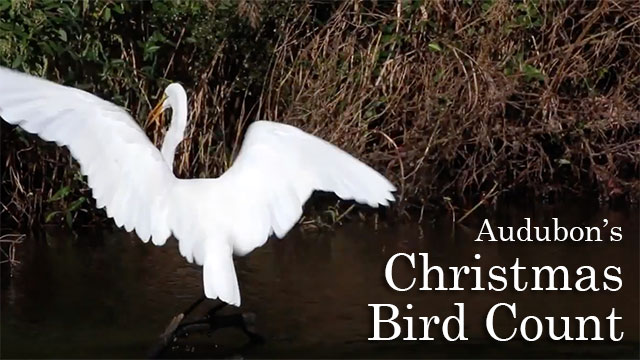
Audubon's Christmas Bird Count
This short film about the National Audubon Society's annual Christmas Bird Count describes the count's history, present day extent, and lessons learned from more than 100 years of data.
In addition to directing, producing, shooting and editing this film, I enjoyed working with the Prelinger Archives to include found footage of historic fashions and flexing my muscles as a Foley artist to create some of the film's background sounds.
Length: ~4.5 minutes. Watch Audubon's Christmas Bird Count.
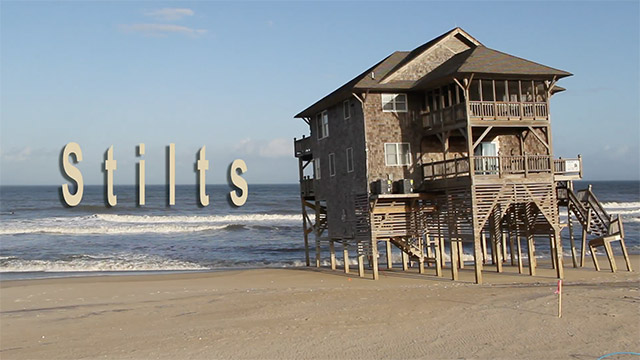
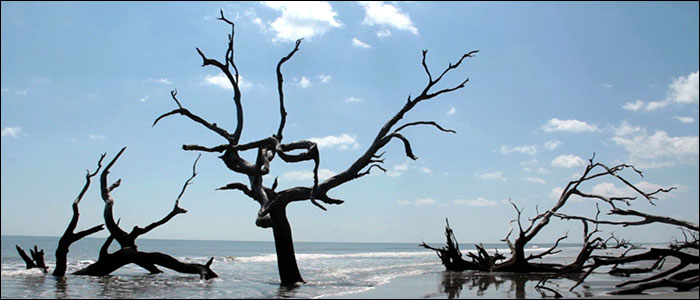
Stilts
Hurricane Irene made landfall in North Carolina on August 27, 2011. Though classified as only a category 1 hurricane, the storm washed out Highway 12 in two areas on Hatteras Island stranding more than 2500 people. Travel to coastal North Carolina to see some of these changes and hear varying local views on sea level rise and climate change.
In addition to directing, producing and editing this film, I especially enjoyed shooting it since I had never been to North Carolina's Outer Banks and the scentery was quite beautiful despite the destruction Irene had caused.
Length: ~8.5 minutes. Watch Stilts.
Technical Highlight Glossy Brochures
The brochures listed below were created while working as a Science Writer for DOE's Energy Exascale Earth System Model (E3SM) project.
Technologies Used: InDesign, Confluence, Photoshop
Data Sources: See each Technical Highlight
Image credit: Steven Smith, Pacific Northwest National Laboratory (PNNL)
List of Technical Highlight Brochures
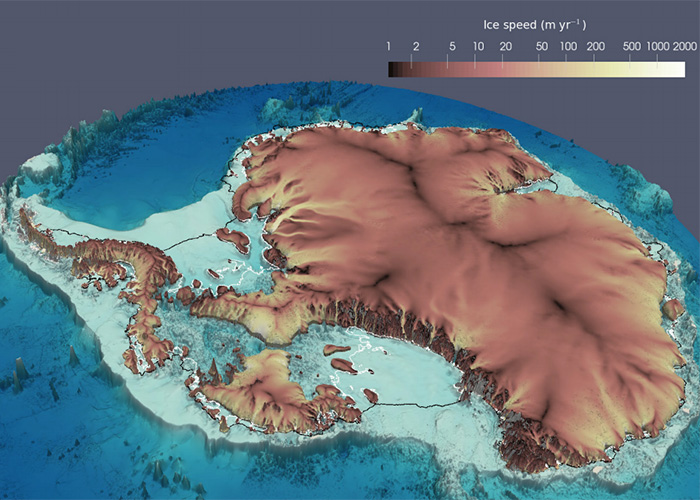
Image credit: MALI Team (including Matt Hoffman and Stephen Price), Los Alamos National Laboratory (LANL)
The Netcdf Operators (NCO): Automatic Remapping Of Gridded Geoscience Data
Analyzing Ocean Mixing At Exascale: Lagrangian, In Situ, Global, High-Performance Particle Tracking (LIGHT)
MPAS-Albany Land Ice (MALI): A Variable-Resolution Ice Sheet Model For Earth System Modeling Using Voronoi Grids
The E3SM Diagnostics Package For Earth System Model Evaluation
Historical Estimates of Atmospheric Reactive Gases and Aerosols by the Community Emissions Data System (CEDS)
E3SM Web Articles
The following web articles were created for the quarterly E3SM Newsletter
Technologies Used: Confluence, Word Press, HTML5, Photoshop
Data Sources: Depends on story - see individual articles for details
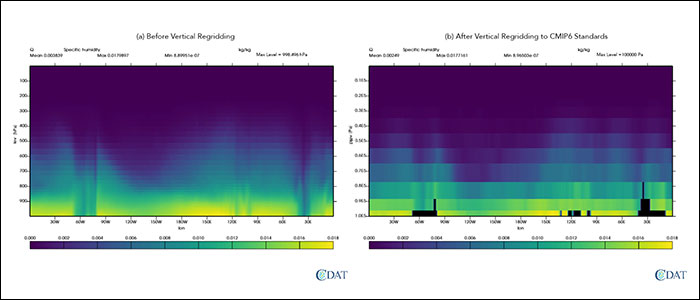
Image credit: Charles Zender, UCI - see "Vertical Regridding" story below for caption
E3SM Newsletter ("Floating Points") Web Articles
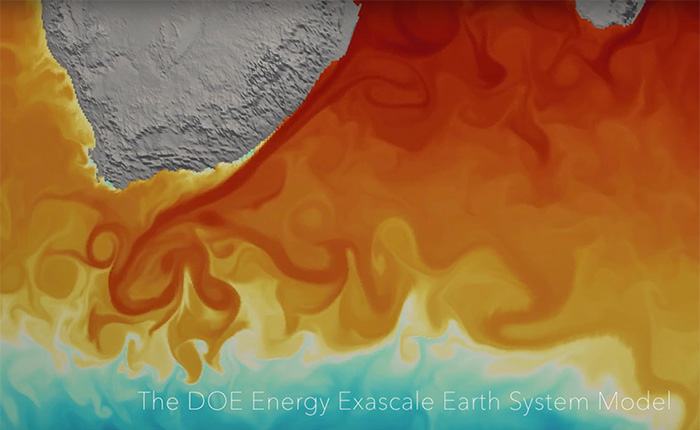
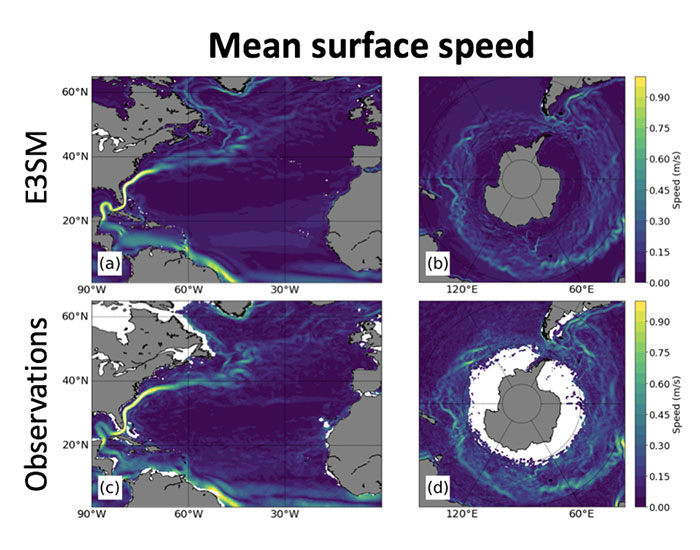
Image credits: Mark Petersen, Los Alamos National Laboratory (LANL). For image context and captions, see "Simulations of the Global Ocean in E3SM" for the top image and "Evaluation of the Ocean and Sea Ice Climate of E3SM" for the bottom.
Simulations of the Global Ocean in E3SM
A Semi-Implicit Barotropic Solver for the E3SM Ocean Model
Evaluation of the Ocean and Sea Ice Climate of E3SM
Antarctic Ice Sheet Simulations
Near-Term Ocean Warming Around Antarctica Affects Long-Term Rate of Sea Level Rise
Detection and Attribution Analysis of Columbia River Basin Streamflow
A Simple Cloud-Resolving E3SM Atmosphere Model
Can We Switch Computers? An Application of E3SM Climate Reproducibility Tests
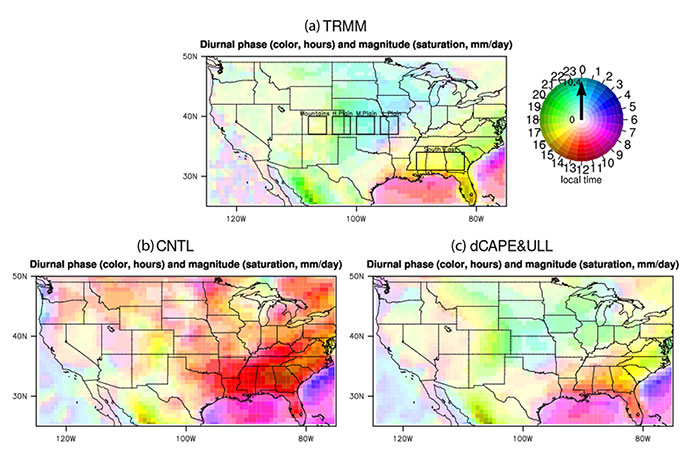
Modeling of the Precipitation Diurnal Cycle Improved
Overview of High-Res Coupled Model
Effects of Phosphorus Cycle on Amazon Carbon Sources and Sinks
New NCO Release Supports Vertical Regridding
E3SM Unified Environment v1.3.0
PIO2 + ADIOS = Performance Improvement
Biological and Environmental Research Awards Announced
E3SM Web Pages
The following web pages were created to explain the Energy Exascale Earth System Model (E3SM) project.
Technologies Used: Confluence, Word Press, HTML5, Photoshop
Data Sources: Varies depending on page
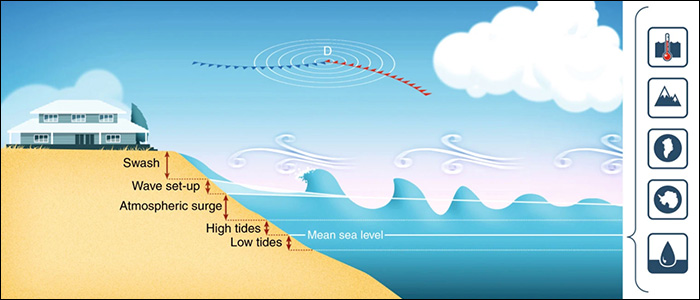
Image Credit: Melet et al., 2018 - see "Coastal Waves" page for figure explanation
Web Pages Created in Collaboration with Scientists
Image credit: Shaocheng Xie (Atmospheric Physics team), Lawrence Livermore National Laboratory (LLNL)
E3SM Next Generation Development for Coastal Waves
Dynamic Land-Ice Modeling - BISICLES
Atmospheric Physics Next Generation Model Development
Performance Analytics for Computational Experiments (PACE) Web Page
Land and Energy Next Generation Model Development
Visual Community Data Analysis Tools (VCDAT) Web Page

Miscellaneous Articles
Includes magazine-length articles, newspaper clips and a short radio piece.
Technologies Used: Word, Adobe Audition
Data Sources: Varies - see stories for details
Image credit: Brian Maebius, Science Illustrator
Magazine-length Articles
Image credit: Brian Maebius, Science Illustrator
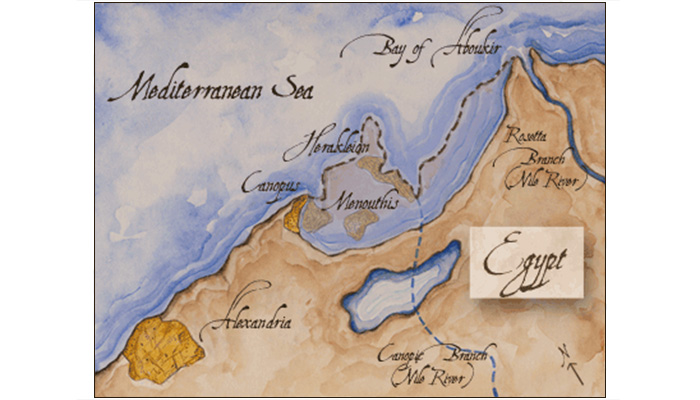
The Sunken Cities of Egypt - created while a graduate student in the University of California, Santa Cruz's Science Communication program
A Volcano's Hum - an example of a “New Scientist”-type magazine article
Newspaper and Radio Articles
Image credit: Holly Davis
Critter Cam - a Monterey County Herald science article
California Condors - another Monterey County Herald science article
The Blackout Blues - yet one more Monterey County Herald article, just for fun
Catching a Plane - a 30-second radio commentary aired on Santa Cruz's KUSP radio station. Transcript of the audio piece.