Data Science Projects
Maximum Temperature Project
This example uses web scraping to gather data, plot it on a map, and display a Plotly interactive boxplot.
Technologies Used: Python, Pandas, Seaborn, Plotly, Jupyter, Leaflet, OpenStreetMap, Stamen Watercolor basemap, and Illustrator
Data Sources: DarkSky API and NextRad Radar Data
Overview
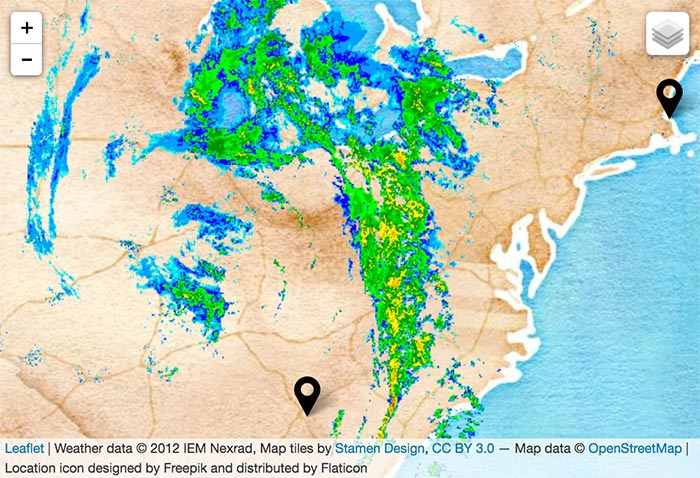
This project involves scraping temperature data from the DarkSky Forecast API, plotting the data from six cities using the Seaborn and Plotly data analysis libraries, and showing current weather radar data on a map marked with the six cities.
The web map uses open source software and real-time weather radar data. (Click on the "layers" icon in the upper right corner of the map to view the different basemaps.)
To view the code used to scrape data from the Dark Sky Forecast API and process it, see the Jupyter Notebook for this project. (The boxplot in the Jupyter Notebook uses the Seaborn library rather than Plotly.)
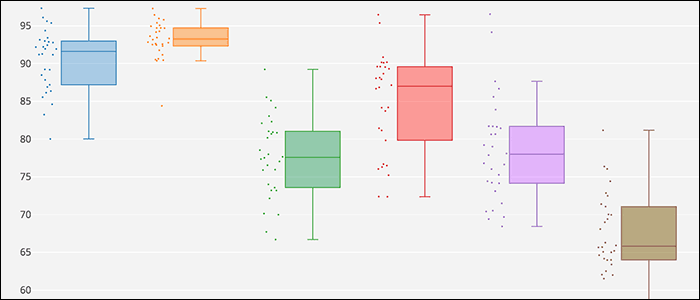
Interactive Plotly Boxplot
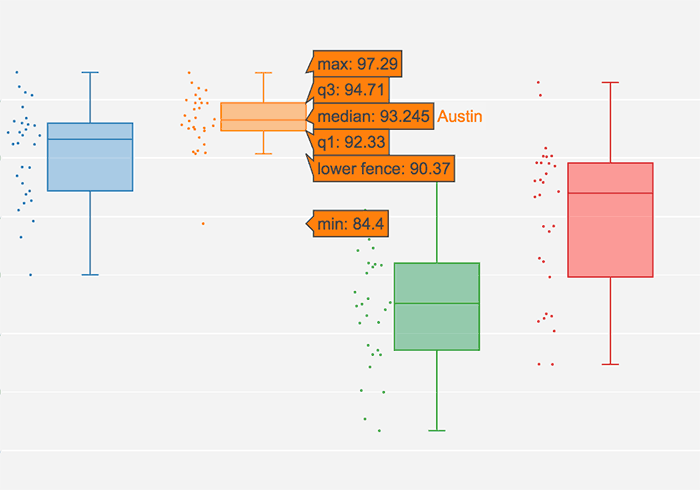
The HTML page for this project uses a Plotly boxplot which allows the user to hover over the boxes in the plot to see the exact values of the relevant statistics.
For this time period (6/7/16 - 7/6/16), the data show that the daily high temperature for Austin has the smallest fluctuation changing only 12.88 degrees over the 30-days compared to Los Angeles, which has the largest range of 28.10°F.
Austin also has the highest mean maximum temperature over the period, indicating that not only is the daily high temperature relatively consistent, but also it just plain hot in Austin in June. Seattle has the lowest daily high temperatures of the six cities considered, which is not surprising given the generally cloudier and rainier climate of the Pacific Northwest, even in June.
Classifying Remote Sensing Data
This project invovled classifying remotely-sensed near-infrared imagery to quantify land loss due to Hurricane Irene.
Technologies Used: ENVI and ArcGIS
Data Sources: Google Earth and the North Carolina Department of Transportation (NCDOT)
Overview & Contextual Map
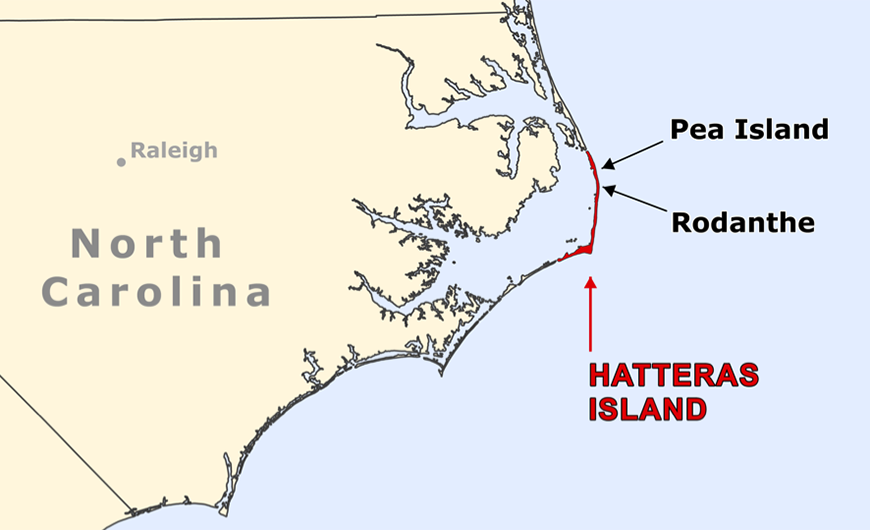
This study used remotely-sensed near-infrared aerial imagery to ultimately measure Hurricane Irene's changes in vegetation, water and land areas on Hatteras Island, NC.
The map to the left shows Hatteras Island, North Carolina, highlighting two areas - Pea Island and Rodanthe - where Hurricane Irene washed out sections of Highway 12 on August 27, 2011 disconnecting the island from the rest of the Outer Banks and mainland. Hatteras Island was accessible only by ferry boat until a temporary bridge was installed on October 10, 2011.
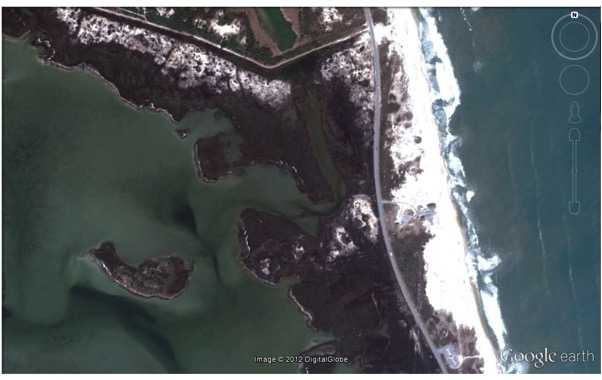
Satellite Photograph - Before Hurricane Irene
Left is a Google Earth satellite image of the Pea Island area of Hatteras Island before Irene hit on August 27, 2011. The road is shown in grey. The Atlantic Ocean is to the right (or east), the Pamlico Sound is to the left (or west) in this image.
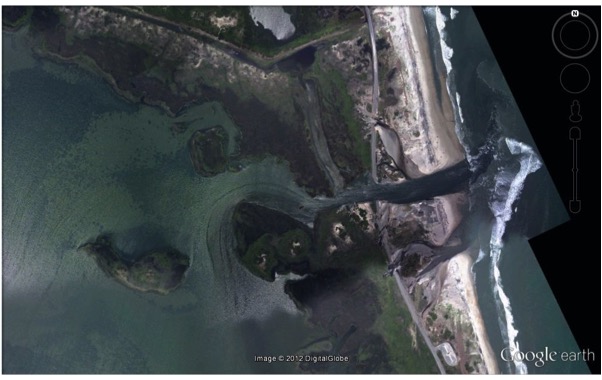
Satellite Photograph - After Hurricane Irene
This Google Earth satellite image of the Pea Island area taken after Irene hit shows a new inlet that connects the Sound and the Atlantic. As Irene moved northward, it passed over Pamilico Sound which ultimately caused floodwaters to flow from the Sound-side of the island toward the Atlantic side washing out Highway 12 in several locations.
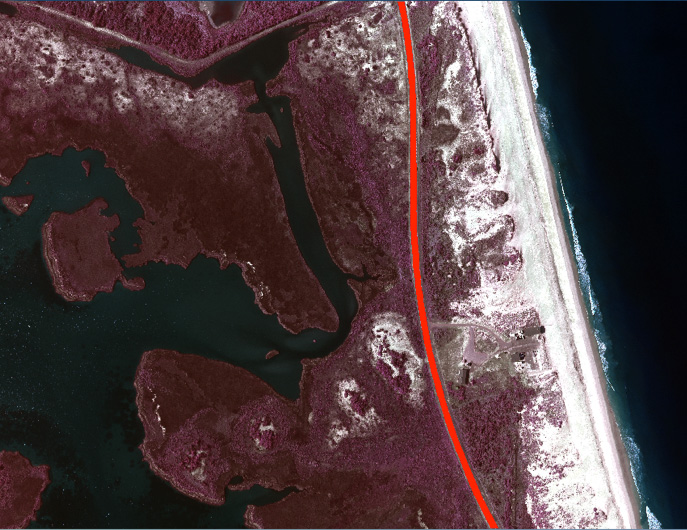
Near-Infrared Aerial Image of Hatteras Island, NC
Left is a remotely sensed aerial image taken via airplane on August 2, 2011 of the Pea Island area of Hatteras Island before Irene hit on August 27, 2011. The highway is shown in bright red and green vegetation is shown in a maroonish red color.
Classification of Land and Water Types Before Hurricane Irene Hit
Since the goal of this study was to quantify changes in water and land areas as a result of Hurricane Irene, my approach involved classifying both the before and after near-infrared images, then determining which areas changed classes between the two images.
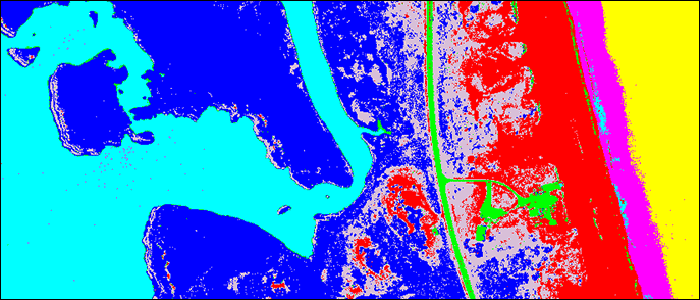
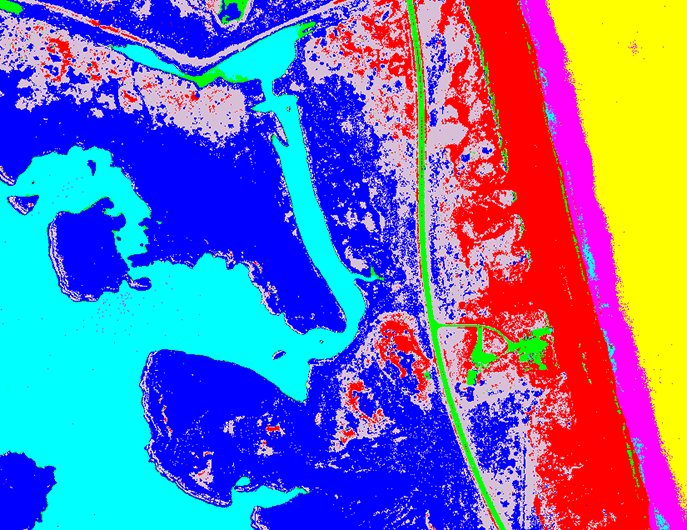
This classification image shows the Pea Island area before the hurricane hit. Water from Pamlico Sound is colored cyan, vegetation is dark blue, the road is green, sand is red, a mixture of sand and vegetation is pinkish-grey and the Atlantic Ocean waters are bright pink and yellow - the bright pink showing the swash zone where the waves are breaking and the water is turbid and full of suspended sediment.
Classification of Land and Water Types After Hurricane Irene Hit
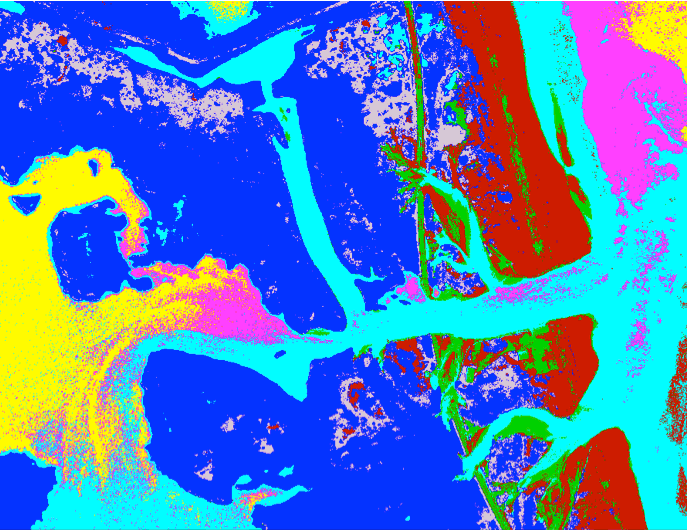
This classification image shows the new inlet - the cyan color cutting horizontally across the middle of the image.
The set of classes (road, vegetation, sound water, etc.) was determined using ENVI's Principal Component Analysis (PCA) of the near-infrared data in the before image. This set of classes was then applied to the after image to determine which areas changed from one class to another.
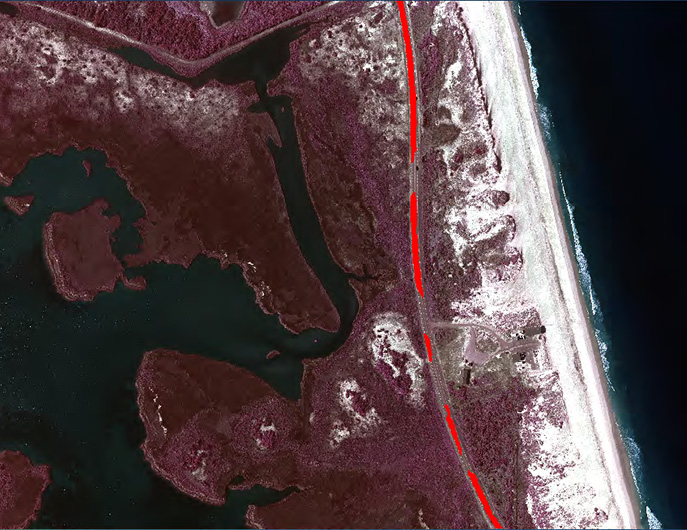
Near-Infrared Aerial Image Showing Amount of Road Loss Near Pea Island
The dashed red line shows the remaining road area after Hurricane Irene washed part of Highway 12 away. The reduced road area is superimposed on the image of the Pea Island section before the storm hit. Hurricane Irene destroyed 2,330.4 square meters of road in this section of Hatteras Island. Other areas of the Island suffered additional road loss not pictured here. The land lost due to inlet formation in the Pea Island section of Hatteras Island is 57,629.0 square meters.

Details of the New York Times Kaggle Competition
Image created by Holly Davis using the Wordle software.
Competition goal: Predict the popularity of New York Times blog articles.
Algorithms Used: I tested logistic regression, CART and random forest statistical models, as well using k-means clustering and bag of words algorithms to improve model results.
Data preparation/Model training: I explored imputing missing data and used 10-fold cross-validation for training the models.
Result: Despite using cross-validation, my final model overfit the data causing my final rank in the competition to be 965 out of 2923 competitors (within the top 33% of competitors). Had I not wanted to squeeze out a little more performance (or if I had had less time to devote to the competition), I would have stopped with a simpler, but quite satisfying random forest model which would have placed 383 out of 2923 (within the top 13% of competitors).

Show of Hands Kaggle Competition
This Kaggle competition involved analyizing data from the "Show of Hands" app.
Technologies Used: R, Kaggle
Data Sources: Show of Hands data
Image credit: Show of Hands
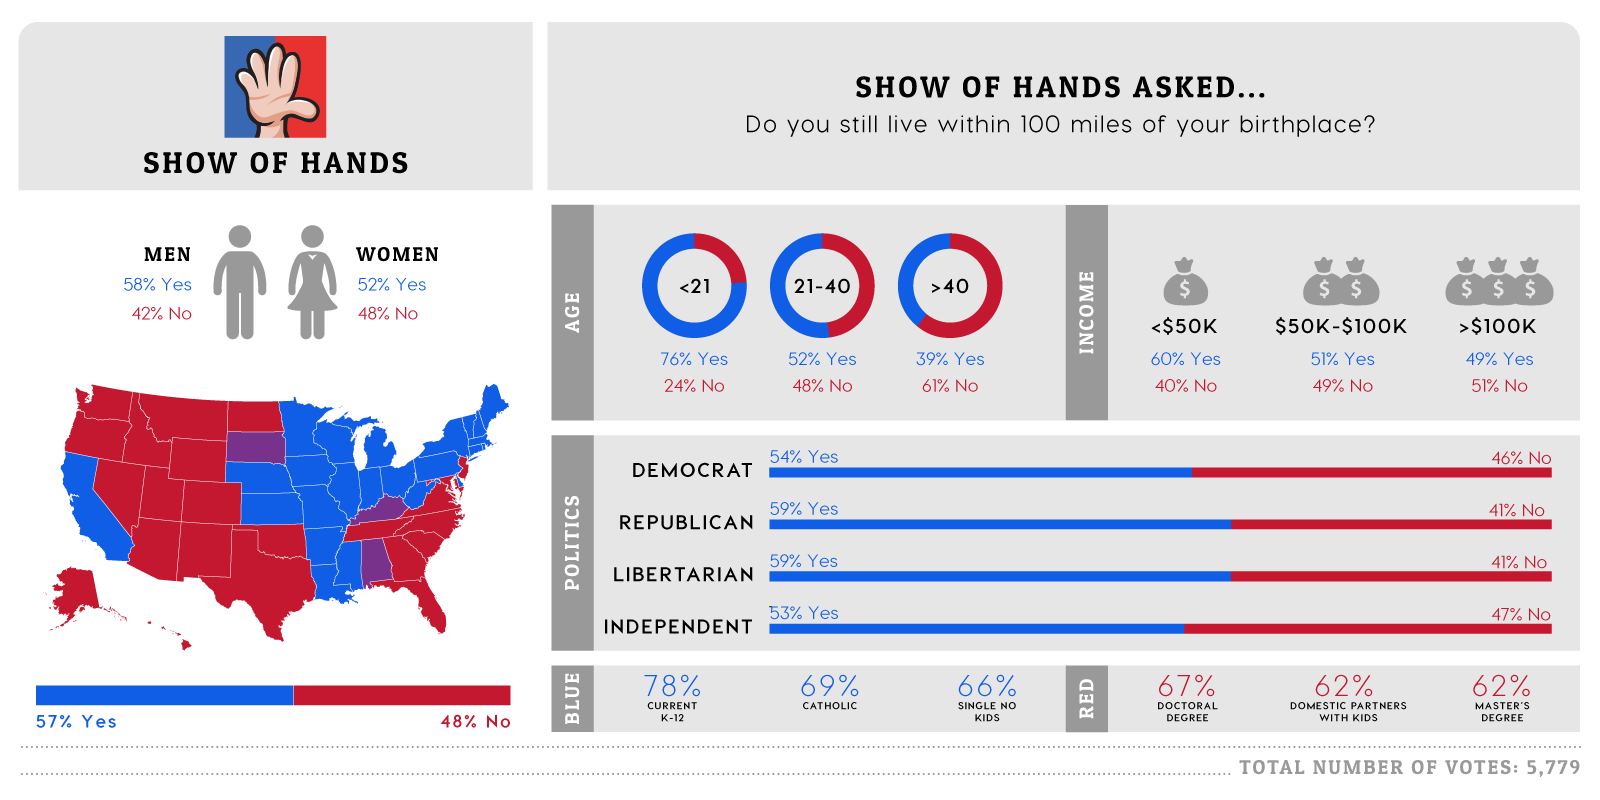
Details of the Kaggle Competition
Image credit: Show of Hands. Image shows the type of data that can be collected using the Show of Hands app.
Competition goal: Predict voting outcomes using informal polling questions from the "Show of Hands" app.
Algorithms Used: Linear regression, CART and random forest.
Data preparation/Model training: During data exploration, I determined that some records were invalid due to a key variable being out of bounds. After removing this spurious data, I imputed values that were missing.
Result: My final rank in the competition was 110 out of 2875 competitors (within the top 4% of competitors). I attribute my high rank to my data preparation since the algorithms used and the training were straightforward.